Enriched Logging in JSON Format
2
gateway94
2
The feature described on this page is available for CA API Gateway Version 9.4 CR1 and later versions of the Gateway. The Container Gateway form factor must be used.
Overview
As a Container CA API Gateway user, you have the option of adopting a 'database-less' audit system to capture your auditing or logging data. By not having to rely on the Gateway's existing configuration database to capture this data (i.e., an external MySQL database), several performance issues can be avoided:
- The exhaustion of the database connection pool
- The filling up of the configuration database
- Gateways failing due to configuration database becoming full
The same issues may occur for users who run Container Gateway in ephemeral mode, in which the typical setup for capturing logs involves an Internal Memory Database.
This database-less system also generates a rich log format, which can be easily translated into the popular JSON format, which can then be readily ingested and transformed by other third party tools for searching and data visualization. This allows the Container Gateway to be compatible with open source tools such as the ELK (Elasticsearch, Logstash, and Kibana) stack. This means that an organization using the ELK stack may opt to use Kibana to view and search logs instead of the Policy Manager.
When logs are enriched, they offer the same level of detail as a standard audit message and can improve the usability of these logs. These details, in the form of metadata, may include a combination of any of the following:
|
|
|
As these details are added by the Gateway to the log messages in real-time, tools such as the ELK stack can use this information (via JSON parsing) to create richer dashboards and reports.
This 'database-less' approach goes hand-in-hand with the CI/CD workflow for the policy development life cycle, which emphasizes treating policy as code.
Disabling the Saving of Audits to a Configuration Database
As the first step in adopting the database-less audit system, modify the default values of 'true' to 'false' for the following system properties:
com.l7tech.server.audit.message.saveToInternal
com.l7tech.server.audit.admin.saveToInternal
com.l7tech.server.audit.system.saveToInternal
Doing so ensures that message audit records, admin audit records, or system audit records will NOT be saved to a configuration database (i.e., a mySQL database)
Enabling Rich Logs in System Properties
To enable rich logs for JSON formatting, you'll need to configure the system property,
com.l7tech.server.audit.log.format
by entering the value of 'json' for it. When rich logs are enabled, this supercedes any audit formatting that may have been made for the following audit cluster properties:
com.l7tech.server.audit.log.service.headerFormat
com.l7tech.server.audit.log.service.footerFormat
com.l7tech.server.audit.log.service.detailFormat
Enabling JSON Formatter
Incoming log messages may be in plain text or already be in JSON format. If in plain text, the message will be formatted and written into the log.message field. if the message is already in JSON format, it will be resolved into a JSON object to preserve the existing JSON format.
To enable the JSON formatter, locate the ssglog.properties file and ensure the
com.l7tech.util.JsonLogFormatter
property is configured. This file is typically found in opt/SecureSpan/Gateway/node/default/etc/conf.See following configuration example.
handlers = com.l7tech.server.log.GatewayRootLoggingHandler, com.l7tech.server.log.ConsoleMessageSink$L7ConsoleHandlercom.l7tech.server.log.GatewayRootLoggingHandler.formatter = com.l7tech.util.JsonLogFormatterjava.util.logging.SimpleFormatter.format=com.l7tech.server.log.ConsoleMessageSink$L7ConsoleHandler.formatter = com.l7tech.util.JsonLogFormattercom.l7tech.server.log.ConsoleMessageSink$L7ConsoleHandler.level = CONFIG
How Enriched Logs Are Collected for Third-Party Consumption
Because the enriched logs are not collected by the Gateway configuration database, the Container Gateway will instead write the logs to
stdout
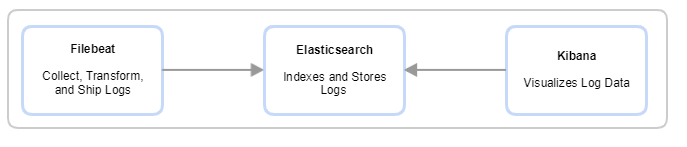
via a console appender. In turn and if required by your logging requirements, the logs can then be collected by a third-party data collector such as Filebeat (likely in its own container) and then transforms and ships the logs to the rest of the ELK stack for indexing, storage, and visualization.To learn more about the ELK stack and how you may implement it, visit their site here.
elk_sample
Comparing Audits, Logs, and Enriched Logs
This section compares a fully-detailed audit message, its log message equivalent, and finally, an enriched log in JSON format.
Audit Message
An audit message is comprised of an audit record that may contain many audit details. These details can be correlated with the JSON-formatted enriched log by the log.id field.
Node : Gateway1Time : 20180808 11:48:52.813Severity : WARNINGRequest Id : 000001651adb7a2e-6Message : Message processed successfullyAudit Record ID: 05005403eae0b155666b5163c0abde3dEvent Type : Message SummaryClient IP : 127.0.0.1Service : test [/test]Operation : nullRqst Length : 0Resp Length : 0Resp Status : 0Resp Time : 0msUser ID : <No ID>User Name : null
Log Message
At a glance, you'll notice that the standard log message is missing the following metadata when compared with the Audit Message: Client IP, Node ID, Request ID, Request Length, User Name, User ID, Response Time, Response Status, and Response Length - detailed information that could be offer deeper insight into a system event or transaction.
2018-08-12T23:48:21.267-0700 WARNING 118 com.l7tech.server.policy.assertion.ServerAuditDetailAssertion: -5: LOG!2018-08-12T23:48:21.367-0700 INFO 118 com.l7tech.server.message: Processing request for service: ok1 [/ok1]2018-08-12T23:48:21.367-0700 WARNING 118 com.l7tech.server.policy.assertion.ServerAuditDetailAssertion: -5: AUDIT!2018-08-12T23:48:21.367-0700 WARNING 118 com.l7tech.server.message: Message processed successfully
Enriched Log Message in JSON Format
An enriched log contains the same details as an audit message would in JSON format, wrapped by the "package", "level", and "time" items as it would appear in a standard log message.
The log.request-id ("request-id") field is used to correlate with a series of related messages for a particular Gateway transaction or event, and like the other metadata listed can be used as a report filter in Kibana.
The log.id ("id") used to correlate with a single audit event.
{ "package": "com.l7tech.server.policy.assertion.ServerAuditDetailAssertion", "level": "WARNING", "log": { "authenticated": "false", "client-ip": "127.0.0.1", "detail-id": "-5", "http-status": "200", "id": "ae7196ff-f2c2-4f0e-b802-f89c57d4cb18", "latency": "0", "message": "AUDIT AUDIT AUDIT", "name": "test [/test]", "node-id": "48b5a4bc60fd4db191ddd5258eab0a35", "request-id": "000001671e6fc406-1", "service": "test [/test]", "status": "No Error", "type": "message" }, "time": "2018-11-16T13:34:35.569-0800"}