View Gateway Audit Events
All audit events are recorded on the gateway for later viewing and troubleshooting. This topic describes the Gateway Audit Event window in detail.
gateway91
All audit events are recorded on the
CA API Gateway
for later viewing and troubleshooting. This topic describes the Gateway Audit Event window in detail.Gateway Audit Events Window
In the Policy Manager, the Gateway Audit Events window displays detailed audit messages for services, administrative, and internal system messages from the
API Gateway
cluster. System audit events (those generated by the
API Gateway
itself) will always be available for viewing within the Gateway Audit Events window. Message auditing events (those triggered by the Audit Messages in Policy assertion) may or may not appear, depending on the level set within the Audit Messages in Policy assertion. For more information, see About Message Auditing.If you need to view logged messages for an individual
API Gateway
node instead, please see View Logs for the Gateway.The Gateway records audit events until the audit logs consume a predefined percentage of the hard disk space. Once this threshold is reached, all message processing ceases until the database utilization drops below the threshold. The threshold is defined in the
audit.archiverShutdownThreshold
cluster property, which by default is 90%. The Ping URI Test is not affected by the threshold, as the pings do not use the message processing framework of the Gateway. If the Gateway and its database is reachable, the Ping URI Test always succeeds, even when all other message processing ceases.
The Gateway Audit Events window provide the following panels to let you search for the following:
- The Audit Record Search Parameters panel lets you filter audit events based on a variety of audit parameters.
- The Entity Search Parameters panel lets you search the history of the selected entity.
- The Associated Logs Search Parameters lets you search based on the audit code.
These panels are collectively referred to as the "audit search panels".
Additionally, the Gateway Audit Events window lets you perform the following tasks:
- Download audit events to an external file
- Delete audit events more than 7 days old
- Start the audit archiver
- Save the audit events to review later.
The system timeout is disabled when the Gateway Audit Events window is open. For more information about the timeout, see Preferences.
To open the Gateway Audit Events window, do one of the following
:- From the Main Menu, click [View] >Gateway Audit Events(on the browser client, from theMonitormenu).The Gateway Audit Events window opens. Audit events from the previous session are shown by default.
- In the Service Metrics window of the Dashboard, right-click anywhere in the moving chart and then selectShow Audit Events<>.time intervalThe Gateway Audit Events window opens loaded with the audit events from the time period selected.
Show/Hide Panels
The following panels in the Gateway Audit Events window can be hidden when not required:
- Time Range panel plus all the audit search panels (all hidden/revealed at once)
- Event details panel
Hiding a panel is convenient when you do not need the controls in that section or if you want to increase screen space for the other panels.
To hide or show a panel, do any of the following
:- Click the appropriate arrow
 just above the pane. It is useful to remember that the Time Range Panel hides by collapsing upward, while the Details Panel hides by collapsing downward.
 - Click [View] >Controlsor [View] >Event Details.
- Use the keyboard shortcuts [Alt + C] (toggle Controls) or [Alt + E] (toggle Event Details)
Source Panel
The Source panel is used to select the source of the audit records to display:
- Internal database: Select this to view audits sent to the internalAPI Gatewaydatabase. You should select this option if you have not set up an external audit store.
- Via audit lookup policy: Select this to view audits that were sent to an external audit store. To use this option, ensure that an external audit store and its associate lookup policy has been correctly configured. For more information, see Manage the Audit Sink and Working with the Audit Lookup Policy.
To view or configure the lookup policy for the audit store, click [
Configure Audit Lookup Policy
] to load the lookup policy in the policy window. When viewing audits from an audit lookup policy, the following actions are unavailable from the File menu: Download Audit Events, Delete Old Audit Events, and Start Archiver. For more information, see Gateway Audit Event Actions later in this topic.
Time Range Panel
The Time Range panel is not available when viewing a saved audit file using the Saved Events task in Policy Manager or when the Gateway Audit Events window is opened from the Service Metrics window in the Dashboard.
The Time Range panel is used to narrow the audit events to a specified time period.
Setting | Description |
|---|---|
Last x hours y minutes | Select this option to specify the most recent number of hours and/or minutes. All audit events generated within this period are eligible to be displayed. |
Auto-Refresh | Specify whether the Gateway Audit Events window should refresh automatically:
|
From/To | Select this option to choose a time range to display audits. Specify the From and To dates either by typing or by clicking  and using the calendar control. Optionally modify the time, if necessary. and using the calendar control. Optionally modify the time, if necessary. |
Time zone | If searching based on a different time zone, select it from the drop-down list. The results are displayed in the time zone selected for the search. If a non-default time zone was used, the time zone is noted next to the time in the [ Details ] tab. |
Audit Record Search Parameters
The Audit Record Search Parameters panel lets you refine the audit events to display.
Setting | Description |
|---|---|
Level | From the drop-down list, select the severity of the events displayed:
|
Service | Display all events from the specified service. You can use wildcards here (for an example, see the Message field). |
Message | Display all events with the specified message. Use the wildcard '*' (asterisk) character to locate messages more easily. Examples:
The search text is not case sensitive. |
Request ID | Displays only audit events with the specified request identifier. You can use wildcards here (for an example, see the Message field). You can use the context variable ${requestId} to access the request identifier. |
Audit Type | From the drop-down list, select the type of audit events to be displayed. For more information about each audit type, see About Message Auditing. |
Node | Display all events from the specified node. |
User Name | Displays only audit events caused by the user with the specified user name. This is the user name used to log onto to the API Gateway via the Policy Manager. You can use wildcards here (for an example, see the Message field).Note that this may return multiple users if more than one person has the same name or if wildcards are used (for example, if the user with the user name "john_smith" exists on more than one configured LDAP, or you search for "*Smith*"). The user name applies as follows for each type of audit:
For more information about the audit types, see About Message Auditing. |
User ID or User DN | Displays only audit events caused by the user with the specified User ID (for internal users defined in the Internal Identity Provider) or User DN (for users defined in an external LDAP). Unlike user names, entering a User ID or User DN uniquely identifies a user. You can use wildcards here (for an example, see the Message field). See "User Name" above for information on how a user is interpreted for each audit type. |
Entity Search Parameters
The Entity Type Search Parameters panel lets you optionally search the history of a selected entity. You can see everything that has happened to that entity and you can see all audits belonging to that entity.
- Entity Type: Choose the type of entity to search from the drop-down list.
- Entity ID: Enter the ID of the entity to search on.
Associated Logs Search Parameter
The Associated Logs Search Parameter panel lets you search the contents of the [Associated Log] tab at the bottom of the viewer window.
- Audit Code: Enter the code of the audit detail to search for. For a list of all the codes, see Audit Detail Codes.
Message Operation Search Parameter
The Message Operation Search Parameter panel lets you search for audits based on a specific SOAP operation in the message.
- Operation: Enter the SOAP operation to search by.
Validate Signatures
The
Validate Signatures
check box allows you to verify the signatures of the audits displayed in the Audit Events Panel.When you select
Validate Signatures
, validation begins immediately and may take a moment to complete, depending on how many audit events were found and how many of those contain signatures. The status bar displays: "Signature validation is on" and the Audit Events Panel displays "Signature validation is on [In Progress
]" to indicate that verification is in progress. "[In Progress
]" is cleared when all audit records in the search result have been validated. While verification is in progress, you can manually clear this check box to suspend signature validation and reselect it to resume.When signature validation is on, the "Sig" column of the Audit Events Panel displays the appropriate icon as each audit is verified. For a description of each icon, see the "Sig" column.
The Validate Signatures check box is available only when there is a connection to the
API Gateway
. Validating signatures may impact API Gateway
performance if audit records for the time period contain large request or response messages or large audit details. The Validate Signature check box is automatically cleared when you perform a new search and when the Gateway Audit Events window is opened. This ensures that validation will occur only when you explicitly select the check box.
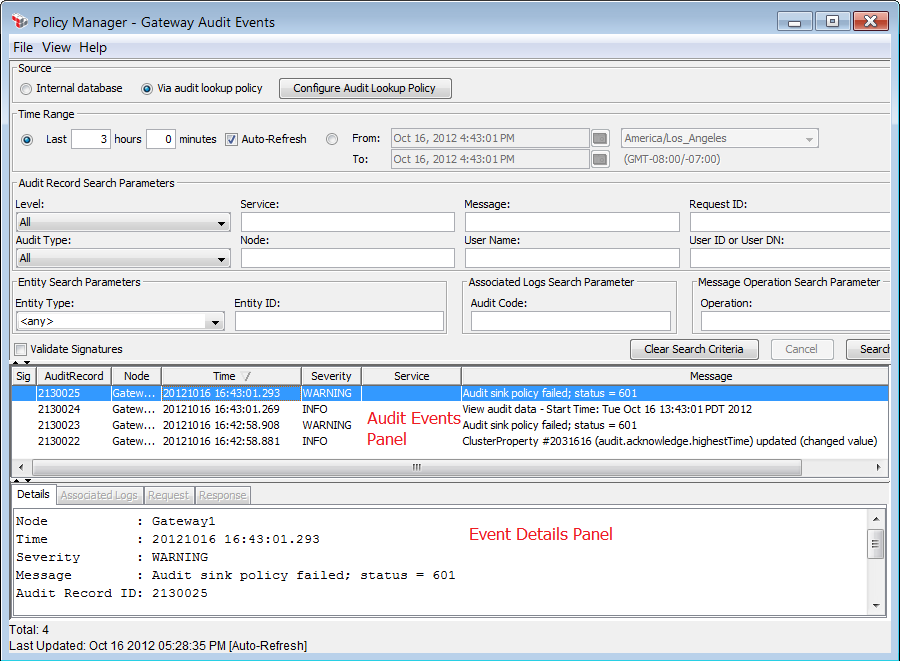
Audit Events Panel
The audit events panel displays the events for the given time period or filter criteria once [
Search
] is clicked. To help you analyze the events, you can click a column heading to re-sort the list based on that column.To clear all search text fields and reset all the drop-down lists to their default settings, click [
Clear Search Criteria
].To cancel a search in progress, click [
Cancel
]. When a search filter is in effect, the following message displays above the Audit Events Panel to indicate that only a subset of records is being shown: "Caution! Constraint may exclude some events." Audit events are displayed only if you have Read permission for "<Any Cluster Node Information>". Some predefined roles (such as "Manage X Service") include this permission. Custom roles may also include this permission.
Column Name | Description |
|---|---|
Sig | Indicates the signature status of the audit record:
Audit signing is controlled by the audit.signing cluster property. |
AuditRecord | Displays the internal audit record number. This number is useful when an audit record refers to another audit record by ID and you want to find that other audit record. |
Node | Displays the API Gateway node that the event applies to. |
Time | Displays the time that the event took place in the API Gateway . This time is displayed in the time zone selected for the search (if not searching by date then the time is displayed in the default time zone). Note that if a non-default time zone is selected, this is not displayed in the event listing but will be displayed in the [Details ] tab. |
Severity | Displays the severity rating for the event, as assigned by the API Gateway .
It is possible to override the severity of the Gateway audit messages, to help you exclude certain material from appearing in the audits. For more information, see Override the Audit Level later in this topic. Note that the events that are displayed depend on the Time Range and Audit Record Search Parameters. |
Service | The service that generated the event, if any. |
Message | The actual event message. |
Event Details Panel
Select an audit event to see detailed information about the event.
Tab | Description |
|---|---|
Details | Displays detailed information about the audit event. |
Associated Logs | Displays any associated logs for the event, if applicable. All audit codes from "The table below lists all the audit messages used by the API Gateway when reporting audit events. These messages are organized into the following high level groupings.
|
Request | Displays the request message received by the API Gateway after any required message processing (for example, WS-Security). Selecting Reformat Request XML will reformat the message for improved readability if XML.If the details have been protected by an Audit Message Filter policy and your role permits it, clicking on the [ Invoke Audit Viewer Policy ] button will invoke the Audit Viewer policy for the audit detail. For more information, see Audit Viewer Policy later in this topic. You can see the request message only if the Save request option is enabled in the Audit Messages in Policy Assertion. |
Response | Displays the response message. Selecting Reformat Response XML will reformat the message for improved readability if XML. If the details have been protected by an Audit Message Filter policy and your role permits it, clicking on the [ Invoke Audit Viewer Policy ] button will invoke the Audit Viewer policy for the audit detail. For more information, see Audit Viewer Policy later in this topic. You can see the response message only if the Save response option is enabled in the Audit Messages in Policy Assertion. |
Total (bottom of window) | Displays the total number of records returned for a search. If there is a large number of records, the Gateway Audit Events window will display "(truncated)" next to the total number. Note that if auto-fresh is enabled, the "(truncated)" label will disappear as soon as new records arrive, even though the display is still truncated. |
Last Updated (bottom of window) | Displays when the log was last updated. When the Gateway Audit Events window is opened from the Service Metrics window of the Dashboard, the time range from the selected bar is displayed here instead. |
Audit Viewer Policy
Information in the [
Associated Logs
], [Request
], or [Response
] tabs may be protected by the Audit Message Filter policy, if one was used to encrypt them. Click [Invoke Audit Viewer Policy
] to invoke the Audit Viewer policy for the audit record or detail. The output of the Audit Viewer policy will be displayed in place of the original text. For more information about the Audit Message Filter and Audit Viewer policies, see Internal Use Policies. Only users with the role "Invoke Audit Viewer Policy" can invoke this policy via the audit viewer. For all other roles, the [
Invoke Audit Viewer Policy
] button is unavailable. For more information on security roles, see Manage Roles. To protect usages of any private key used in the Audit Viewer policy, see Make Audit Viewer Key in Private Key Properties.Gateway Audit Event Actions
While the Gateway Audit Events window is primarily for display, you can perform the following actions:
Download Audit Events
The Download Audit Events option is not available when the Gateway Audit Events window is opened from the Service Metrics window of the Gateway Dashboard. In the browser client version of the Policy Manager, downloading is possible only when the Java applet is running in the trusted mode.
To download audit events in the database to an external file
:- From the Gateway Audit Events window, select [File] >Download Audit Events.The Download Audit Events window appears.
- Specify the Time Range for audit events to be downloaded: All:
- Download all audit events in the database.
- From/To: Download only those events that fall within the time range. You can either type the time values or click to select the date from the calendar control. You can also change the time zone if necessary.
- Specify the Published Services to be included:
- All: Include all services. Note that this option will include all the system events that are automatically generated.
- Selected: Select one or more services to include (hold down the [Ctrl] key to select multiple services).
- Do one of the following to specify the destination file:
- Type the full path and name of the file.
- Click [Browse] and then navigate to the target location, then enter a file name.
- Click [Download]. The audit events are saved to the specified zip file.
- Click [Close] when done.The audit events are saved as a colon-delimited text file within a zip file. The file is accompanied by a digitally-signed XML file containing checksum and metadata information about the exported audit records. The XML file is signed using the Gateway's SSL certificate.
Delete Audit Events
The Delete Old Audit Events option is not available when the Gateway Audit Events window is opened from the Service Metrics window of the Gateway Dashboard.
It is recommended that you purge old audit records periodically to free up hard disk space and to prevent performance issues. By default, the Policy Manager purges all non-SEVERE audit records older than seven days. Audit events marked “SEVERE” are never removed, regardless of age.
Tip:
You can adjust the minimum age for purging with the audit.purgeMinimumAge
cluster property.To delete audit events:
- From the Gateway Audit Events window, select[File] > Delete Old Audit Events.
- Click [Delete Events] when prompted to confirm.Deletion will occur in the background, so that you can keep working. An audit event is created immediately and refreshes itself after every 10,000 events are deleted. This lets you monitor the progress of the deletion.If the deletion is interrupted before it is complete (for example, a system failure occurs), the audit event will show the number of events purged up to that point. When the system restarts, run Delete Old Audit Events again to finish the purge.
Start Archiver
The Start Archiver option is not available when the Gateway Audit Events window is opened from the Service Metrics window of the Gateway Dashboard.
This command is used to manually start the audit archiver if it is not already running, based on the settings in the Configure FTP Audit Archive task. The status of the archive will be displayed on the Audit Events window.
This manual archive will not affect the scheduled archive task. For example, the default as specified by the
audit.archiverTimerPeriod
cluster property is to archive every 10 minutes. This will occur regardless of how many manual archive requests were made.Save Displayed Events
In the browser client version of the Policy Manager, saving displayed events is possible only when the Java applet is running in the trusted mode.
Before saving audit events, be sure the events you want to save are currently displayed. Data that is filtered out will not be saved.
To save the currently displayed audit events:
- From the Gateway Audit Events window, select [File] >Save as.
- Specify a file name and location or accept the defaults shown.Accepting the suggested file name makes it easier to sort and organize your saved events. Be sure to preserve the ".ssga" file extension
- Click [Save].Saved audit events do not include the time zone. This means that when the events are viewed, they will be displayed in the default time zone
To view the saved events:
- See "Saved Events" below.
Saved Events
You can view saved events even when not connected to the
API Gateway
.To view saved audit events:
- From the Policy ManagerMain Menu, click [View] >Saved Events(on the browser client, from the Monitor menu).
- Navigate to the appropriate ".ssga" file.
- Click [Open].The saved audit events are displayed. You can view and filter the saved events in the same manner as live events.
The saved data uses the node names that were in effect at the time of saving. This may differ from node names currently in use.
Override the Audit Level
It is possible to change the severity of audit messages at run time to suit your needs. For example, you are finding that the auditing system is flagging material that you do not wish to appear in the audit logs. To solve this, identify the messages to suppress and then reassign them to a lower severity level to prevent them from being logged.
The following cluster properties are used to override audit levels:
- audit.setDetailLevel.SEVERE
- audit.setDetailLevel.WARNING
- audit.setDetailLevel.INFO
- audit.setDetailLevel.CONFIG
- audit.setDetailLevel.FINE
- audit.setDetailLevel.FINER
- audit.setDetailLevel.FINEST
- audit.auditDetailExcludeList
Add the number of the audit detail code to the appropriate property to reassign the code to that level. Separate multiple codes with spaces. If a code appears in more than one property, the higher audit level takes precedence.
Note that codes entered into the property
audit.auditDetailExcludeList
are excluded from auditing entirely. (1) Overriding an audit level only changes the severity at run time. It does not change the level of the audit when displayed in the Gateway Audit Events window. (2) The
audit.setDetailLevel.*
cluster properties are hidden and not selected from the drop-down list in Manage Cluster-Wide Properties. To use them, manually type the name in the Key field of the dialog box.