Configure Gateway for External Service Metrics
By default, the gateway stores service metrics in its internal database. These metrics are displayed on the . For improved performance and stability, you can configure the Gateway to store metrics data to an external site, away from the internal database. Not only will this free up disk space, but it could avoid issues with clustering and database replication.
gateway94
By default, the
CA API Gateway
stores service metrics in its internal database. These metrics are displayed on the Gateway Dashboard. For improved performance and stability, you can configure the Gateway to store metrics data to an external site, away from the internal database. Not only will this free up disk space, but it could avoid issues with clustering and database replication.Storing service metrics externally is independent of the
serviceMetrics.enabled
cluster property. Once external storage is configured, metrics data accumulates even if the cluster property is set to 'false'.This means you can control the collection of metrics fully as follows:
- Internal database only:Do not configure external metrics and andserviceMetrics.enabled= true
- External collection only:Configure external metrics andserviceMetrics.enabled= false
- All metrics collection enabled:Configure external metrics andserviceMetrics.enabled= true
- All metrics collection disabled:Do not configure external metrics and andserviceMetrics.enabled= false
The same metrics data is stored, whether the Gateway is configured to store them internally or externally. Storing metrics in both places is not common. But it could be useful in instances where you want some redundancy during transition from internal to external.
You can use a tool such as Grafana to view metrics stored in an external location.
See an example of Gateway service metrics in GitHub.
Contents:
2
2
Context Variables
Name | Type | Description |
metrics | Message | Contains the JSON format message containing the service metrics data. This variable is available only in policy-backed service operation policy fragment for service metrics. |
Cluster Properties
See Service Cluster Properties. In particular, these two properties are relevant to the configuration of external service metrics:
- serviceMetrics.enabled
- serviceMetricsEventListener.maxPoolSize
Configuration Procedure
To configure the Gateway for external service metrics:
- Create a policy with the following properties:
- Policy Type:Policy-Backed Service Operation Policy Fragment
- Policy Tag:com.l7tech.external.assertions.pbsmel.server.ServiceMetricsProcessor
- Action:process
- Craft a backing policy to manipulate the metrics data according to your needs.Design your backing policy to be as efficient as possible, as it is called once for each request that is processed by the Gateway.
- Run the Manage Policy-Backed Services task.
- ClickCreateand enter a name for your policy-backed service.
- In theTypedrop-down list, selectcom.l7tech.external.assertions.pbsmel.server.ServiceMetricsProcessor.
- Select the line that appears in the table and clickAssign. Then select the policy that you created in step 1.
Sample Backing Policy
The following is a simple backing (foundation) policy:
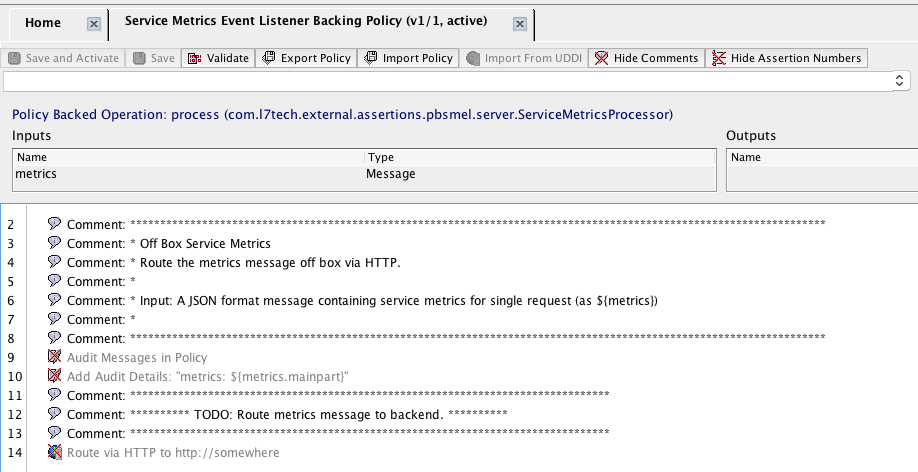
Input to the backing policy is a JSON-formatted message that contains service metrics information:
{  "time" : 1518734278251,
   "formattedTime" : "2018-02-15T14:37:58.251-08:00",
   "nodeId" : "48b5a4bc60fd4db191ddd5258eab0a35",
   "nodeName" : "Gateway1",
   "nodeIp" : "10.242.45.121",
   "serviceId" : "13df5d4767ea633273940598aa2f323c",
   "serviceName" : "Test Service 1",
   "serviceUri" : "/test1",
   "totalFrontendLatency" : 234,
   "totalBackendLatency" : 123,
   "isPolicySuccessful": true,
   "isPolicyViolation" : false,
   "isRoutingFailure" : false
}
Where:
Name | Type | Description |
time | Integer | Time the request was received by the Gateway |
formattedTime | String | Time the request was received by the Gateway, formatted in ISO 8601 format with timezone information |
nodeId | String | Gateway node ID |
nodeName | String | Gateway node name |
nodeIp | String | Gateway IP address |
serviceId | String | Published service ID |
serviceName | String | Published service name. |
serviceUri | String | Published service resolution URI. |
totalFrontendLatency | Integer | The time that it took for the Gateway to process a request that is received from a client, then send a response back to the client (in milliseconds). |
totalBackendLatency | Integer | The total accumulated time that it took for the Gateway to forward the request, then receive a response from a back-end service (in milliseconds). |
isPolicySuccessful | Boolean | True if policy executed successfully, otherwise false |
isPolicyViolation | Boolean | True if policy violation occurred, otherwise false. |
isRoutingFailure | Boolean | True if routing failed, otherwise false |
Frequently Asked Questions
Question | Answer |
What does the 'metrics' entry mean in the policy window? | This context variable 'metrics' is the input for the policy-backed service. This variable is analogous to the request message that the Gateway routes to a service. The 'metrics' variable contains the JSON payload with the metrics information. You then craft your policy to manipulate these metrics however you want–route, transform, edit, whatever. (1) You can show/hide the list of inputs/outputs by toggling the Inputs and Outputs option on the View menu (available in the desktop client only). (2) You can resize the space for the inputs/outputs list by dragging the split bar between the list and the policy window. |